By Rabah Arezki, Olivier Blanchard
IMF
 Oil prices have plunged recently, affecting everyone: producers, exporters, governments, and consumers. Overall, we see this as a shot in the arm for the global economy. Bearing in mind that our simulations do not represent a forecast of the state of the global economy, we find a gain for world GDP between 0.3 and 0.7 percent in 2015, compared to a scenario without the drop in oil prices. There is however much more to this complex and evolving story. In this blog we examine the mechanics of the oil market now and in the future, the implications for various groups of countries as well as for financial stability, and how policymakers should address the impact on their economies.
In summary:
- We find both supply and demand factors have played a role in the sharp price decline since June. Futures markets suggest that oil prices will rebound but remain below the level of recent years. There is however substantial uncertainty about the evolution of supply and demand factors as the story unfolds.
- While no two countries will experience the drop in the same way, they share some common traits: oil importers among advanced economies, and even more so emerging markets, stand to benefit from higher household income, lower input costs, and improved external positions. Oil exporters will take in less revenue, and their budgets and external balances will be under pressure.
- Risks to financial stability have increased, but remain limited. Currency pressures have so far been limited to a handful of oil exporting countries such as Russia, Nigeria, and Venezuela. Given global financial linkages, these developments demand increased vigilance all around.
- Oil exporters will want to smooth out the adjustment by not curtailing fiscal spending abruptly. For those without savings funds and strong fiscal rules, budgetary and exchange rate pressures may, however, be significant. Without the right monetary policies, this could lead to higher inflation and further depreciation.
- The fall in oil prices provides an opportunity for many countries to decrease energy subsidies and use the savings toward more targeted transfers, and for some to increase energy taxes and lower other taxes.
- In the euro area and Japan, where demand is weak and conventional monetary policy has done most of what it can, central banks forward guidance is crucial to anchor medium term inflation expectations in the face of falling oil prices.
Again, our simulations of the impact of the oil price drop do not represent a forecast for the state of the world economy in 2015 and beyond. This we will do in the IMF’s next World Economic Outlook in January, where we will also look at many other cross-currents driving growth, inflation, global imbalances and financial stability.
What follows is our attempt to answer seven key questions about the oil price decline:
What Are the Respective Roles of Demand and Supply Factors?
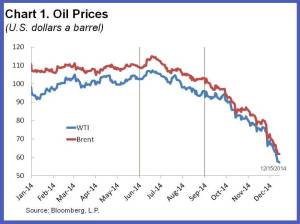
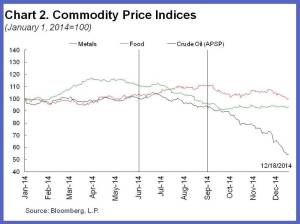
Oil prices have fallen by nearly 50 percent since June, 40 percent since September (see Chart 1).[2] Metal prices, which typically react to global activity even more than oil prices, have also decreased but substantially less so than oil (see Chart 2). This casual observation suggests that factors specific to the oil market, especially supply ones, could have played an important role in explaining the drop in oil prices.
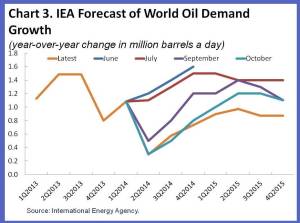
A closer look reinforces this conclusion. Revisions between June and December of International Energy Agency forecasts of demand (see Chart 3), combined with estimates of the short run elasticity of oil supply, suggest that unexpected lower demand between then and now can account for only 20 to 35 percent of the price decline.
On the supply side, the evidence points to a number of factors, including surprise increases in oil production. This is in part due to faster than expected recovery of Libyan oil production in September and unaffected Iraq production, despite unrest.[3]
A major factor, however, is surely the publicly announced intention of Saudi Arabia—the biggest oil producer within OPEC—not to counter the steadily increasing supply of oil from both other OPEC and non-OPEC producers, and the subsequent November decision by OPEC to maintain their collective production ceiling of 30 million barrels a day in spite of a perceived glut.
The steady increase in global oil production could be seen as “the dog that didn’t bark.” In other words, oil prices had stayed relatively high in spite of the upward trajectory in global oil production due to the perception at the time of OPEC’s induced floor price. The resulting shift by the swing producer however helped trigger a fundamental change in expectations about the future path of global oil supply, in turn explaining both the timing and magnitude of the fall in oil prices, bringing the latter closer to the level of a competitive market equilibrium. A similarly dramatic drop took place in 1986, when Saudi Arabia voluntarily stopped being the swing producer, causing oil prices to fall from $27 to $14 per barrel, only to recover fifteen years later, in 2000.
Beyond traditional demand and supply factors, some have pointed to “financialization”—oil and other commodities considered by financial investors as a distinct asset class—and “speculation” as contributors to the price decline.[4] We see little evidence that this is the case. According to the latest report from the International Energy Agency, oil inventories have reached their highest level in two years, suggesting expectations of price increases, not price declines.
How Persistent is This Supply Shift Likely to be?
This depends primarily on two factors:
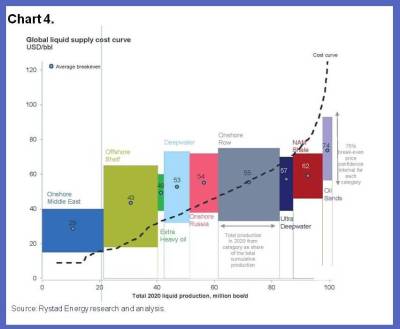
The first is whether OPEC, and in particular Saudi Arabia, will be willing to cut production in the future. This in turn depends in part on the motives behind its change in strategy, and the relative importance of geopolitical and economic factors in that decision. One hypothesis is that Saudi Arabia has found it too costly, in the face of steady increases in non-OPEC supply, to be the swing producer and maintain a high price. If so, and unless the pain of lower revenues leads other OPEC producers and Russia to agree to share cuts more widely in the future, the shift in strategy is unlikely to change soon. Another hypothesis is that it may be an attempt by OPEC to reduce profits, investment, and eventually supply by non-OPEC suppliers, some of whom face much higher costs of extraction than the main OPEC producers (see Chart 4, which gives the world marginal cost curve, showing how much it costs to produce an additional barrel by type of oil extraction).
The second factor is how investment and in turn oil production will respond to low oil prices. There is some evidence that capital expenditure on oil production has started to fall. According to Rystad Energy, overall capital expenditure of major oil companies is 7 percent lower for the third quarter of 2014 compared to 2013.
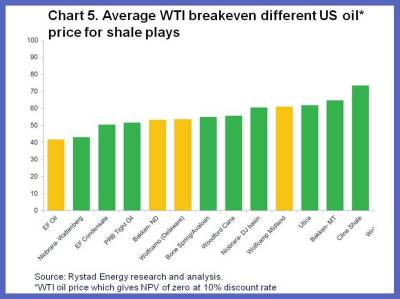
Available projections from the same source indicate that capital expenditures will fall markedly throughout 2017. For unconventional oil, such as shale, (which now accounts for 4 million out of a world supply of 93 million barrels a day), the break-even prices—the oil price at which it becomes worthwhile to extract—of the main United States shale fields (Bakken, Eagle Ford and Permian) are typically below $60 per barrel (see Chart 5 which gives break-even prices for the United States shale fields).
At current prices (around $55 per barrel), Rystad Energy’s projections suggest that the level of oil production could decline but only moderately by about less than 4 percent in 2015. Rates of return will be significantly lower, however, and some highly leveraged firms that did not hedge against lower prices are already under financial stress and have been cutting their capital expenditure and laying off significantly.
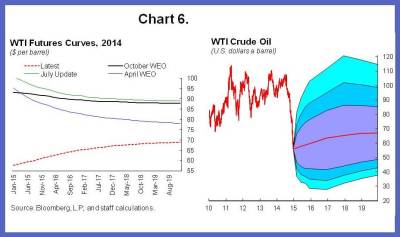
Thus, other things being equal, the dynamic effects of low prices on supply should lead to a decrease in supply relative to the initial shift and thus to a partial recovery of prices. This is what is suggested by futures markets, which show, in the left hand side panel of Chart 6, an expected recovery of prices to $73 a barrel by 2019.
The uncertainty associated with these forecasts comes not only from supply but also demand factors.
On the supply side, for example, possible changes in OPEC’s strategy and geopolitical tensions in Libya, Iraq, Ukraine, and Russia should not be underestimated. On the demand side, uncertainty about global economic activity and thus the derived demand for oil remains high. This is shown, emphatically, by the size of the implied distribution of futures prices (based on options prices) in the right hand side panel of Chart 6: the 68% confidence band for the price in 2019 ranges from $48 to $85, the 95 percent band from $38 to $115; a very wide range indeed.
What Are the Effects Likely to be on the Global Economy?
Overall, lower oil prices due to supply shifts are good news for the global economy, obviously with major distribution effects between oil importers and oil exporters. The crucial assumptions in quantifying the effects of those supply shifts are how large and persistent we expect them to be. These assumptions determine not only the path of adjustment, but also the initial reaction of consumers and firms.
Given the uncertainty about the relative importance of supply shifts, both now and expected in the future, we present the results of two simulations (these are ceteris paribus in nature—not projections about the global economy, and as such ignoring all other shocks likely to affect the global economy), which we see as representing a reasonable range of assumptions. The first assumes that the supply shift accounts for 60 percent of the price decline reflected in futures markets. The second also assumes that the supply shift accounts for 60 percent of the price decline at the start but that the shift is partly undone over time for the reasons described above, with its contribution to the price decline going gradually to zero in 2019.[5]
The results of the simulations shown below capture only the effects of the supply component of the oil price decline (the demand driven component of the oil price decline is a symptom of slowing global economic activity rather than a cause). The oil price projection used in the simulations is based on the IMF’s price forecast, which is itself based on futures contracts.
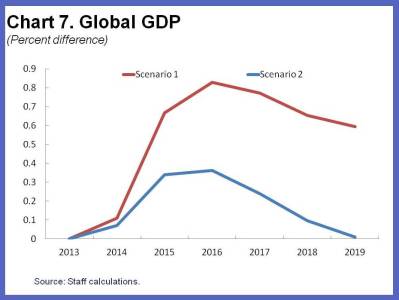
The results for global GDP are shown in Chart 7. The first simulation implies an increase in global output of 0.7 percent in 2015 and 0.8 percent in 2016 relative to the baseline (the situation without the oil price drop. Not surprisingly, in the second scenario, the effect on output is smaller, of the order of 0.3 percent in 2015 and 0.4 percent in 2016. The range of these effects includes predictions which would be obtained using existing empirical estimates for advanced economies. Estimates from Blanchard and Gali (2009) for example find that the effect of a permanent (supply driven) decrease in the price of oil by 10 percent leads to an increase in U.S. output by about 0.2 percent.[6] Given a supply component of the price decline of about 25% (60% of a total decline of 40%), these estimates would therefore imply an increase in output of about 0.5%.
These global results mask asymmetric effects from lower prices across countries. Winners are the (net) oil importing countries, losers are (net) oil exporting countries. But, even within each group, there are important differences.
What Are Likely to be the Effects on Oil Importers?
There are three main channels through which a decrease in the price of oil affects oil importers. The first is the effect of the increase in real income on consumption. The second is the decrease in the cost of production of final goods, and in turn on profit and investment. The third is the effect on the rate of inflation, both headline and core.
The strength of these effects varies across countries:
For example, the real income effect is smaller for the United States, which now produces over half of the oil it consumes, than for the euro zone or for Japan. The real income and profit effects also depend on the energy intensity of the country: China and India remain substantially more energy intensive than advanced economies, and thus benefit more from lower energy prices. The share of oil consumption in GDP is on average 3.8 percent for the United States, compared to 5.4 percent for China and 7.5 percent for India and Indonesia.[7]
In normal times, monetary policy would respond to lower core inflation through a more than one-for-one decrease in the nominal interest rate, and thus a lower real interest rate. However, times are not normal, and the major advanced economies are constrained by interest rates at zero, leaving aside quantitative easing. While the United States, which is getting closer to exiting this zero lower bound, can respond to a decrease in inflation by delaying the timing of its exit, the euro zone and Japan, which are expected to remain at the zero lower bound for a long time, cannot materially change their conventional monetary policy.
Our simulations reflect, to the best possible extent, these differences in energy intensity, in the proportion of oil produced at home, and in monetary policy constraints. We assume that inflation expectations are similarly anchored in the United States, the euro zone, and Japan, leading to a pass through of about 0.2, so a decrease in core inflation of 0.2 percentage points when headline inflation decreases by 1 percentage point.
The implications for GDP are shown in Chart 8 for the two simulations described earlier.
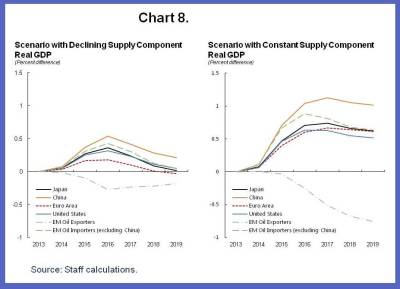
The effect on China in both scenarios are larger than those for Japan, the United States and euro zone countries. For China, GDP increases 0.4-0.7 percent above the baseline in 2015, and 0.5-0.9 percent in 2016. For the United States, GDP increases 0.2-0.5 percent above the baseline in 2015, by 0.3-0.6 percent in 2016. (The simulation assumptions do not take into account the potential offset from some policies that governments may implement following the fall in oil prices. For example, China may decide to tighten monetary or fiscal policy in response to the oil price decline).
Other effects are relevant, which our simulations do not take into account. Among them:
Some oil importers depend heavily on what happens to oil exporters, and thus may benefit less from lower oil prices. For example, low-income importers in the Caribbean that benefit from transfers under Venezuela’s Petrocaribe regime could face a marked reduction in transfers as Venezuela itself comes under pressure. Caucasus and central Asia oil importers are likely to experience adverse spillovers from slowing growth in their oil exporting neighbors, particularly Russia, which will reduce non-oil exports and remittances. Mashreq countries and Pakistan might also be adversely affected through a decline in non-oil exports, official transfers and remittances from the member countries of the Gulf Cooperation Council, especially over the medium term.
Read more from the IMF


Discussion
No comments yet.